introduction
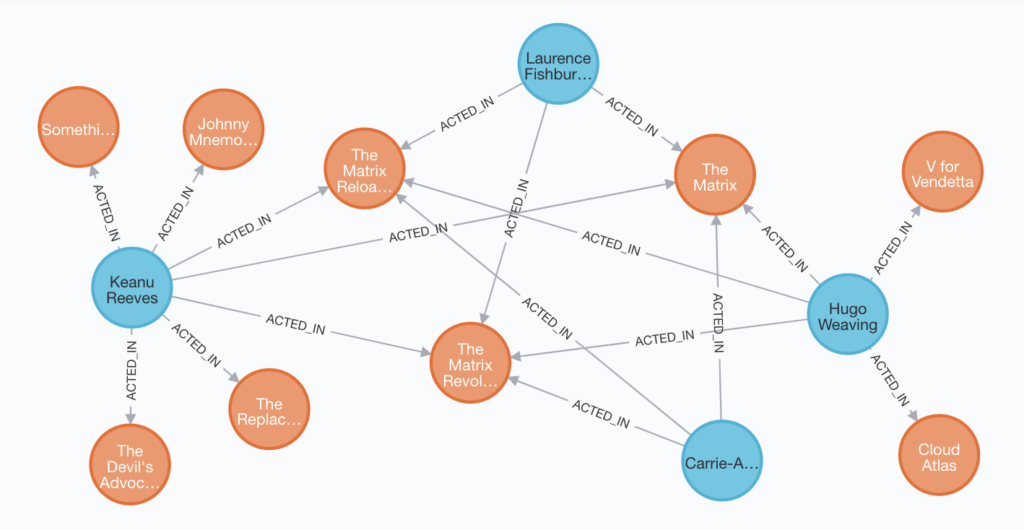
A knowledge graph is a knowledge-based modeling data understood by a machine. It is intended to accumulate and convey real-world knowledge. The nodes (or vertex) of the graph represent entities (objects, events, situations, abstract concepts…) which are linked together by edges representing the relationships between the entities. Simple statements can be accumulated as edges in the data graph (e.g. Paris is the capital of France).
To make a graph even more expressive, an ontology or rules could be added to define quantified statements (e.g. all capitals are cities). Deductive methods can then be used to entail and accumulate new knowledge (e.g., Paris is a city).
Knowledge graphs are often built from several heterogeneous sources. These sources may have differences in structure and granularity. It is therefore necessary to define:
- A schema: a high-level structure of the graph
- A vocabulary: list of entities that correspond to nodes
- A context: specific setting in which a unit of knowledge is held to be true
Creating a knowledge graph
The first natural source of information to create content for a knowledge graph is provided by human collaboration. Contributors can be found in-house (e.g. employees of a company expert in their domain), crowdsourcing platform (e.g. user comments), collaborative-editing platforms (e.g. wikipedia). Despite a high cost, problems can appear like human error, disagreement, prejudice or vandalism.
Other rich and abundant sources of information are text corpora, like scientific articles, newspapers, books, social media, etc. A classic task scheduling scheme starts with a Named Entity Recognition (NER) system that identify the category of a word or group of word in a text such as “person”, “city”…
Next, an Entity linking (EL) assigns a unique identity to a word or group of word.
Finally, the relationship extraction system (RE) will find and categorize the relationships between the entities. Still, using these cascades of techniques to extract relevant information with good quality remains a challenge.
Data structured in different formats can also be used to build a knowledge graph (for example, relational databases and table files such as CSV, tree-structured formats such as JSON or XML, ontologies in owl format, etc). The challenge in that case, will be to create scripts that will transform the source files into a graph.
Whatever the sources used and the efforts made, the graph will be incomplete, with errors, contradictions and duplicates, in particular if several heterogeneous sources are used. A quality assessment step in relation to the targeted applications is therefore necessary. It is possible to use refinement techniques to (semi-)automatically complete and correct the knowledge graph.
Reasoning
To make the knowledge of a graph explicit we can use deductive or inductive methods (2).
Given the graph data as a starting point and some general rules about the world that we may know a priori, we can use a deductive process to derive new data not explicitly given initially. When the rules are shared by many people, they are part of “common sense knowledge”. Conversely, when they are rather shared only by a few experts in a domain, they are part of “domain knowledge”.
Machines do not have access to such deductive faculties. They must be given formal instructions to make similar inferences. In this way, we will make the semantics of the graph more explicit in a machine-readable format. Once instructed, machines can (often) make inferences with precision, efficiency, and scale beyond human performance. These inferences can serve many applications, such as improving query response, classification, finding inconsistencies, etc.
While deductive knowledge is a precise logical consequence, induction creates new knowledge from prediction made by a model based on graph data. These predictions are sometimes associated with a level of confidence and although fallible, they can be very valuable. Among the models used, we can cite the symbolic models that will use rule mining or axiom mining to create prediction, numerical techniques (to detect clusters of nodes to find their centroids for example), machine learning models whether through unsupervised, semi-supervised or supervised learning techniques who can produce a representation of the data in a low-dimensional model to more easily compare the nodes to each other.
Hence, Knowledge graphs have emerged as a compelling abstraction for organizing the world’s structured knowledge, and a way to integrate information extracted from multiple data sources.